
Eventually a formula was found to work with a database of all the match scores and results from 1897 that would find each team's best result from any given number if matches. The results can be found starting here: Best and Worst Sequences of Matches.
What is truly remarkable about the tables of best results from 10,25,50,75,100,150, 200 and 300 consecutive matches is how many of the top places are filled by Geelong. Although many teams have won 10 matches in a row, the Geelong side of 1897 has the highest for and against percentage from 10 consecutive wins. The Geelong teams of 1952-3 hold the best result from 25 matches and in recent seasons, Geelong teams have established new League records with their results from 50 (2007-9), 75 (2007-10), 100 (2007-11), 150 (2007-13).
Now the Cats have an opportunity to take the 200 title as well.
Interested in the history of the Greatest Club of All? Head to 'Footy Histories' to purchase amazing books on the 1951/52 and 1963 Geelong Premiership sides.
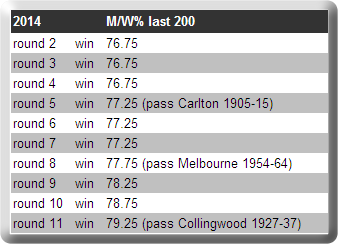
The win in round 1 this year, saw Geelong equal Hawthorn's best match/win percentage from 200 matches and they nudged ahead on for and against percentage of the Hawk's club record set in 1982-90. Match Win Percentage (M/W%) is calculated by multiplying wins + draws divided by 2 by 100 and dividing the result by matches played. Draws are counted as half a win; otherwise, they would count as losses. (Geelong's best result from 200 matches before round 9 2011 was a m/w% of 68.75% with a percentage of 117.52% from round 16 1960 to round 16 1970.)
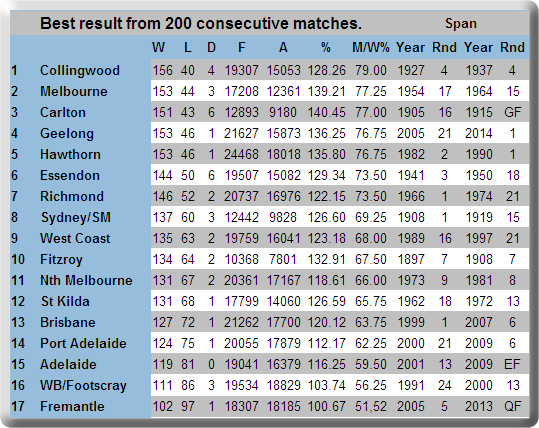 |
Although Geelong with a superior for and against percentage appears to be only four and half wins (2.25% of m/w%) away from taking top position from Collingwood 1927-37, what is equally important in the calculations is what was happening 200 matches ago.
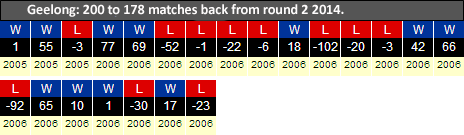 |
Two hundred matches back from round 2 2014 was the 1-point win against Richmond in round 22 2005. While it is important for Geelong to keep winning currently, what is equally important is the losses from 2006 dropping out of the sequence. If Geelong keeps winning from round 2 2014 onwards, the match/win% from the last 200 will only improve when those wins coincide with losses going out at the other end.
A win against Brisbane will mean that Geelong still has 153 wins and 1 draw from the last 200 matches with the possibility of a lower for and against percentage because a 76 point win over West Coast in round 21 2005 is no longer included.
 |
However, with more losses from 2006 to lose, Geelong could afford three losses from the first 14 matches of 2014 and still have 158 wins, 41 losses and 1 draw from 200 matches for a m/w% of 79.25%. Beyond that there are more possibilities as the late 2006 and early 2007 losses go out.
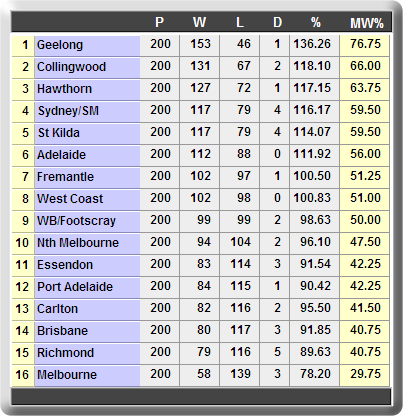
All Teams Last 200 Matches - back from round 1 2014.